2026-10-14 · STT
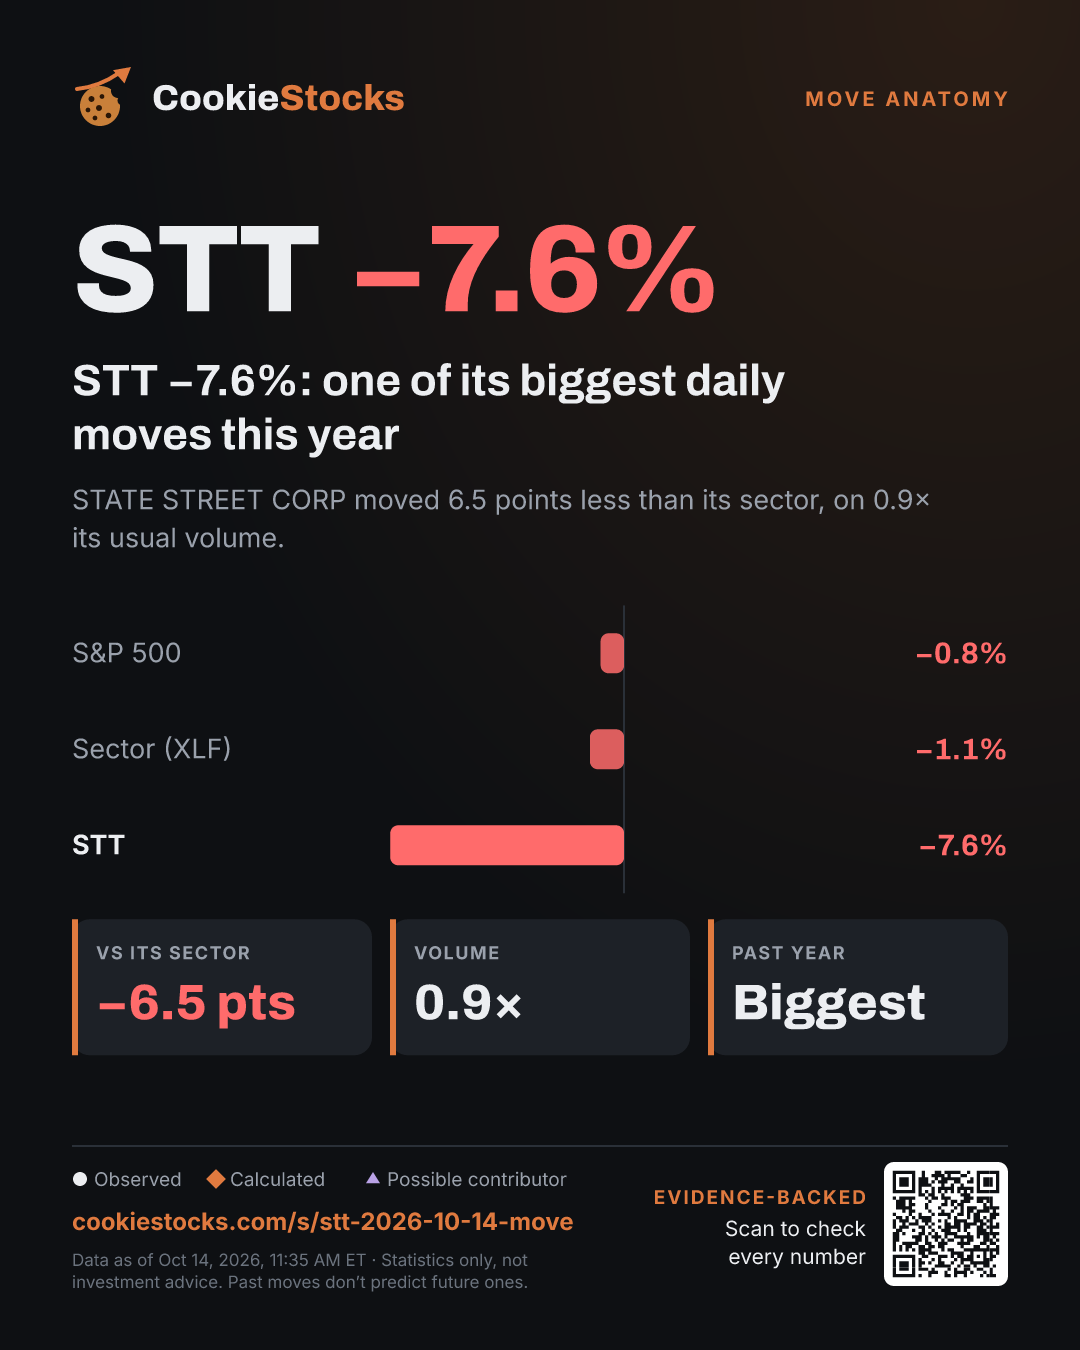
STT −7.6%: one of its biggest daily moves this year
STATE STREET CORP moved 6.5 points less than its sector, on 0.9× its usual volume.
The story in plain words
Wednesday, October 14, 2026. STT −7.6%: one of its biggest daily moves this year. STATE STREET CORP moved 6.5 points less than its sector, on 0.9× its usual volume.
What the data shows for State Street Corporation (STT): STT −7.6% today. Its sector fund (XLF) −1.1% today. S&P 500 (SPY) −0.8% today.
Worked out from that data: 6.5 points less than its sector. Volume 0.9× its 20-day average. Its biggest daily move in the past 250 trading days. After the 10 most similar STT days since Oct 27, 2021, the stock was higher 5 days later 6 of 10 times (History, not a forecast).
Possible contributors. These line up in time with the move; they are not confirmed causes: News: “These S&P500 stocks are gapping in today's session” (Published around the move. Timing only, not a confirmed cause). News: “State Street Stock Tumbles as Cash Outflows Offset Growth in ETFs” (Published around the move. Timing only, not a confirmed cause). 8-K filed: Earnings results, Executive or director change, Regulation FD disclosure (Filed around the move. Timing only). 3 filed (Filed around the move. Timing only).
About the company: State Street Corporation trades as STT and is part of the S&P 500, in the Financials sector (Asset Management & Custody Banks), headquartered in Boston, Massachusetts, founded in 1792.
This is one of CookieStocks’ daily stock stories about unusually large one-day price moves in S&P 500 stocks, measured against each stock’s own history, its sector and its usual volume. Stories are found automatically each trading day from market data and SEC filings, and every claim is labelled as observed, calculated or a possible contributor. Statistics only, not investment advice.
Prove it
Every claim on the graphic, labelled: observed (straight from the data), calculated (worked out from it), or possible contributor (lines up in time, not a confirmed cause).
- OBSERVEDSTT −7.6% todayOct 14, 2026, 11:35 AM ET
- OBSERVEDIts sector fund (XLF) −1.1% todayOct 14, 2026, 11:35 AM ET
- CALCULATED6.5 points less than its sectorHow: stock return − sector fund return · Oct 14, 2026, 11:35 AM ET
- OBSERVEDS&P 500 (SPY) −0.8% todayOct 14, 2026, 11:35 AM ET
- CALCULATEDVolume 0.9× its 20-day averageHow: today’s volume ÷ average of the last 20 days · Oct 14, 2026, 11:35 AM ET
- CALCULATEDIts biggest daily move in the past 250 trading daysHow: share of past daily moves smaller in size · Oct 14, 2026, 11:35 AM ET
- POSSIBLE CONTRIBUTORNews: “These S&P500 stocks are gapping in today's session”Published around the move. Timing only, not a confirmed cause. · Oct 14, 2026, 10:35 AM ET
- POSSIBLE CONTRIBUTORNews: “State Street Stock Tumbles as Cash Outflows Offset Growth in ETFs”Published around the move. Timing only, not a confirmed cause. · Oct 14, 2026, 8:51 AM ET
- POSSIBLE CONTRIBUTOR8-K filed: Earnings results, Executive or director change, Regulation FD disclosureFiled around the move. Timing only. · Source: SEC EDGAR · Oct 14, 2026, 4:00 PM ET
- POSSIBLE CONTRIBUTOR3 filedFiled around the move. Timing only. · Source: SEC EDGAR · Oct 13, 2026, 4:00 PM ET
- CALCULATEDAfter the 10 most similar STT days since Oct 27, 2021, the stock was higher 5 days later 6 of 10 timesHistory, not a forecast. · How: same-company days with a move of similar size and direction
More stories
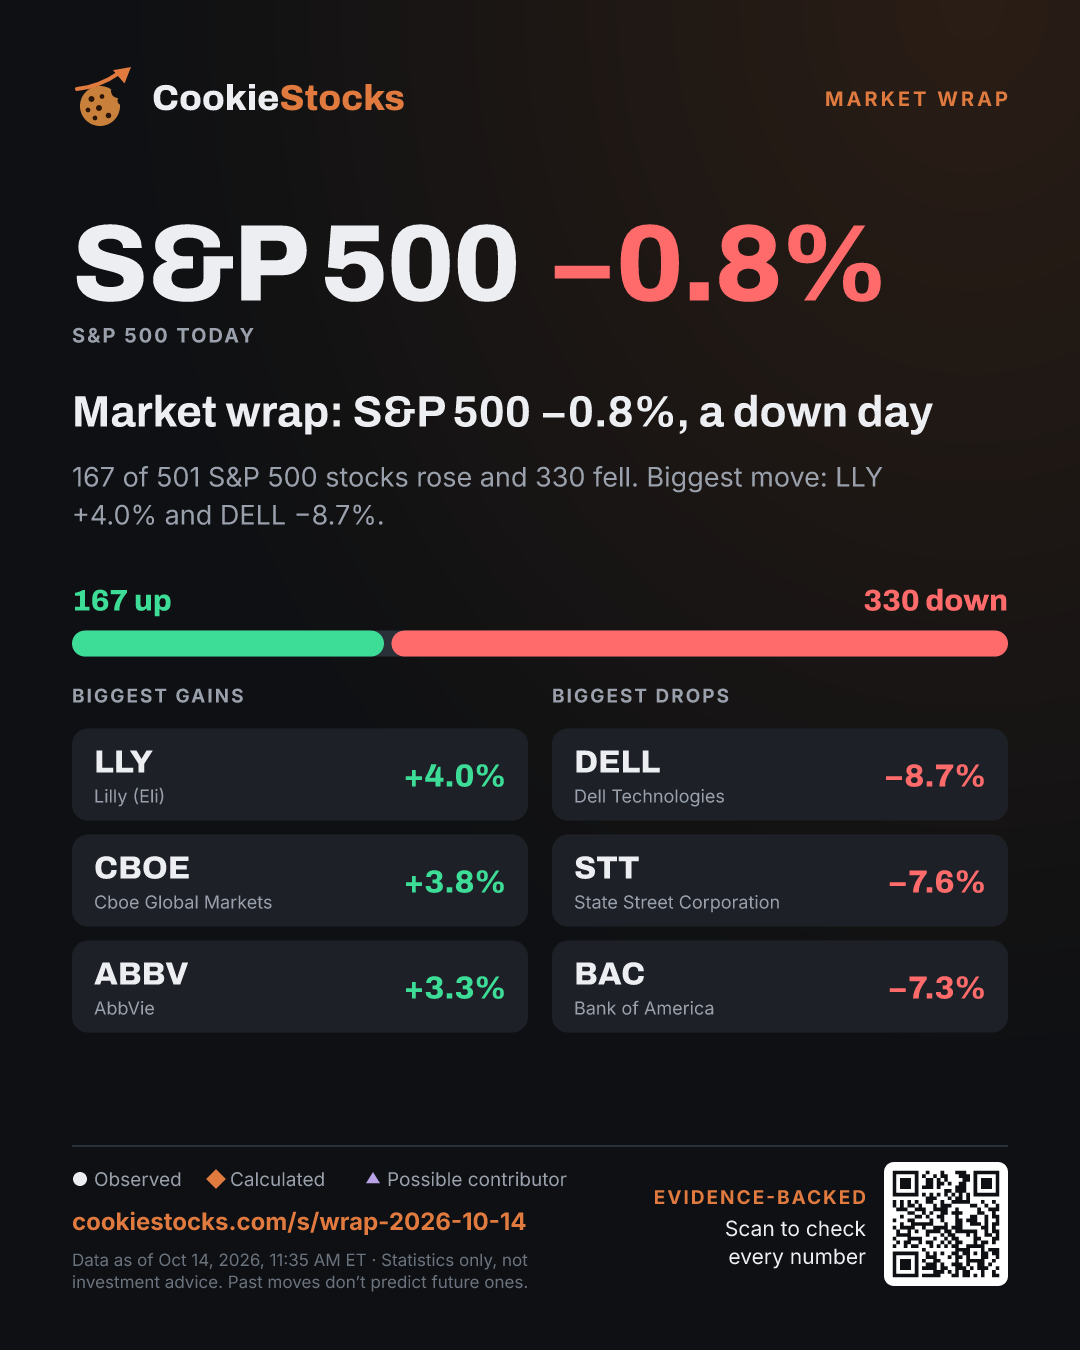 Market wrap: S&P 500 −1.1%, a sharply lower day2026-10-14
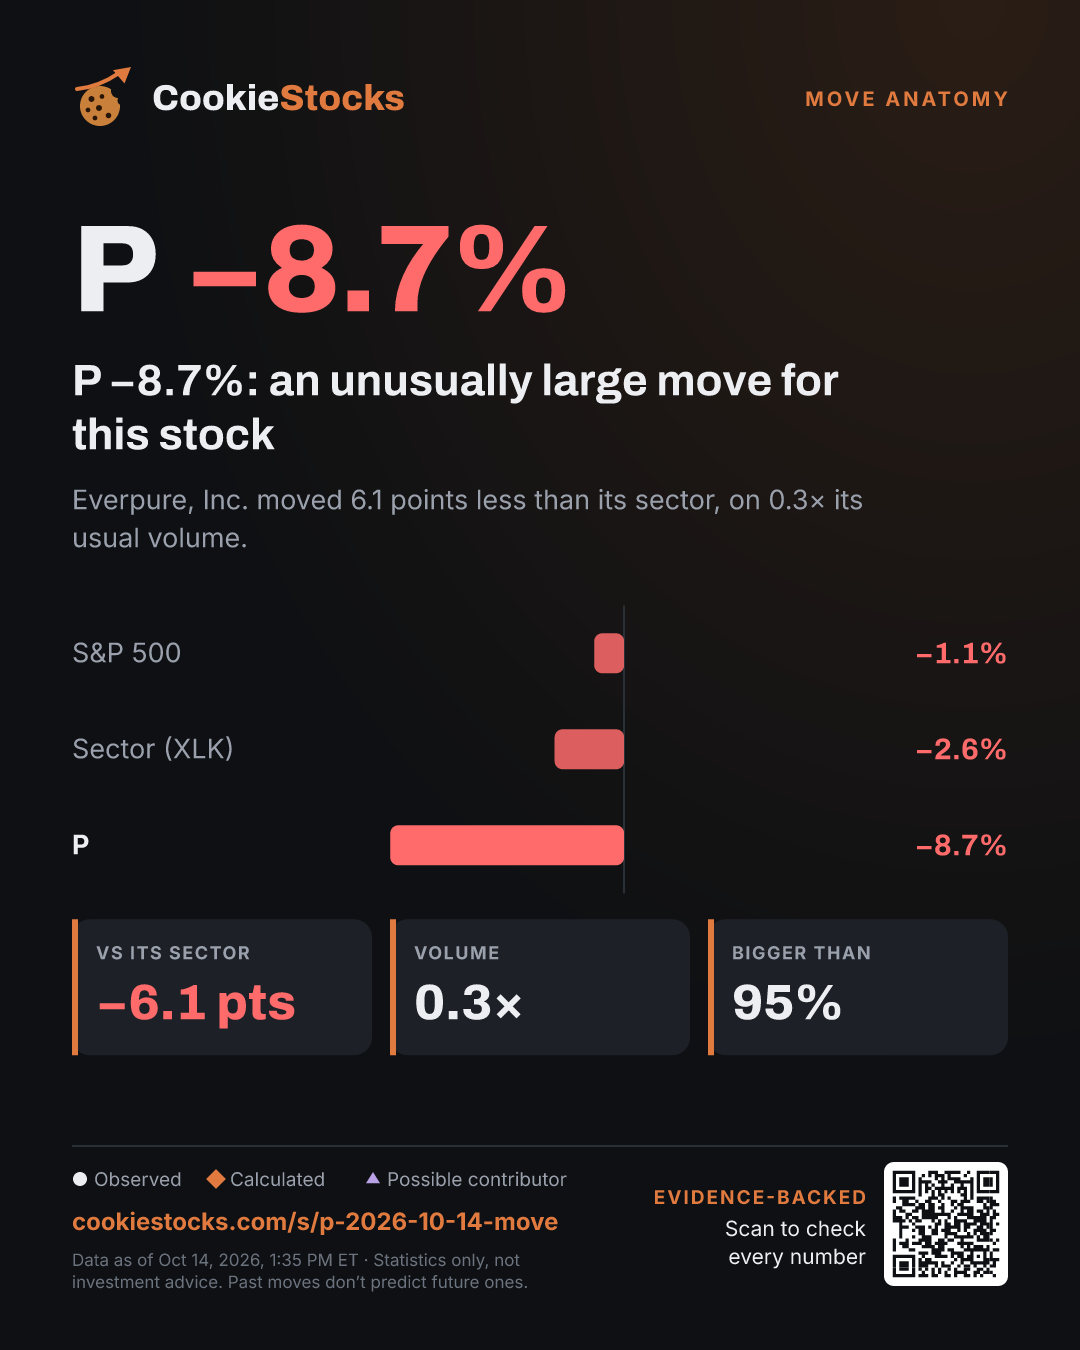 P −8.0%: an unusually large move for this stock2026-10-14
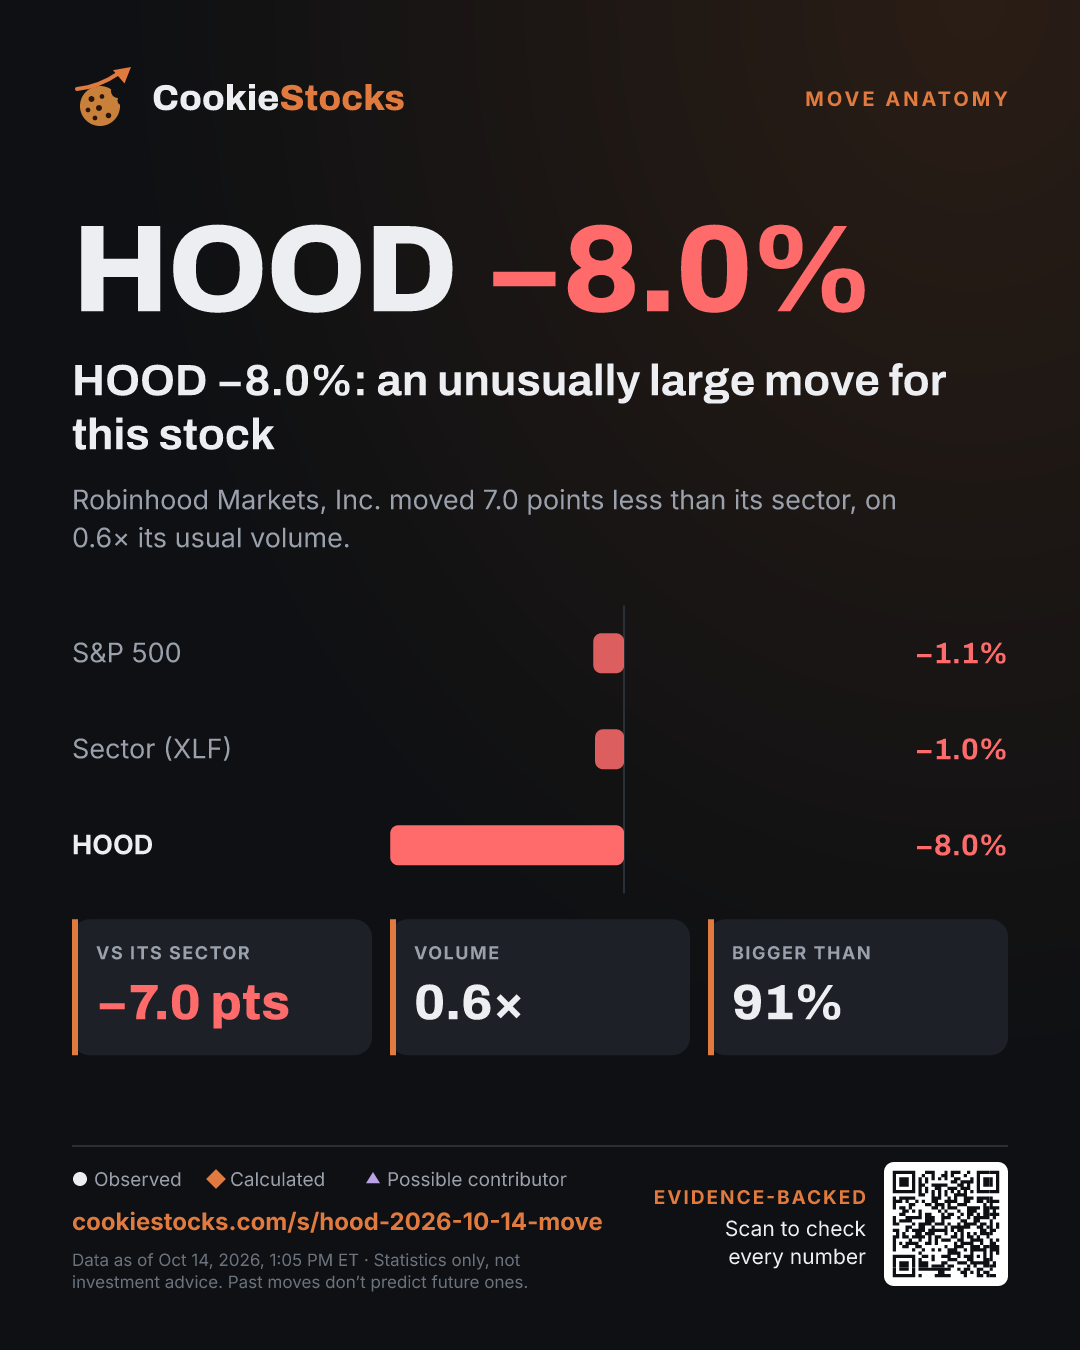 HOOD −8.0%: an unusually large move for this stock2026-10-14
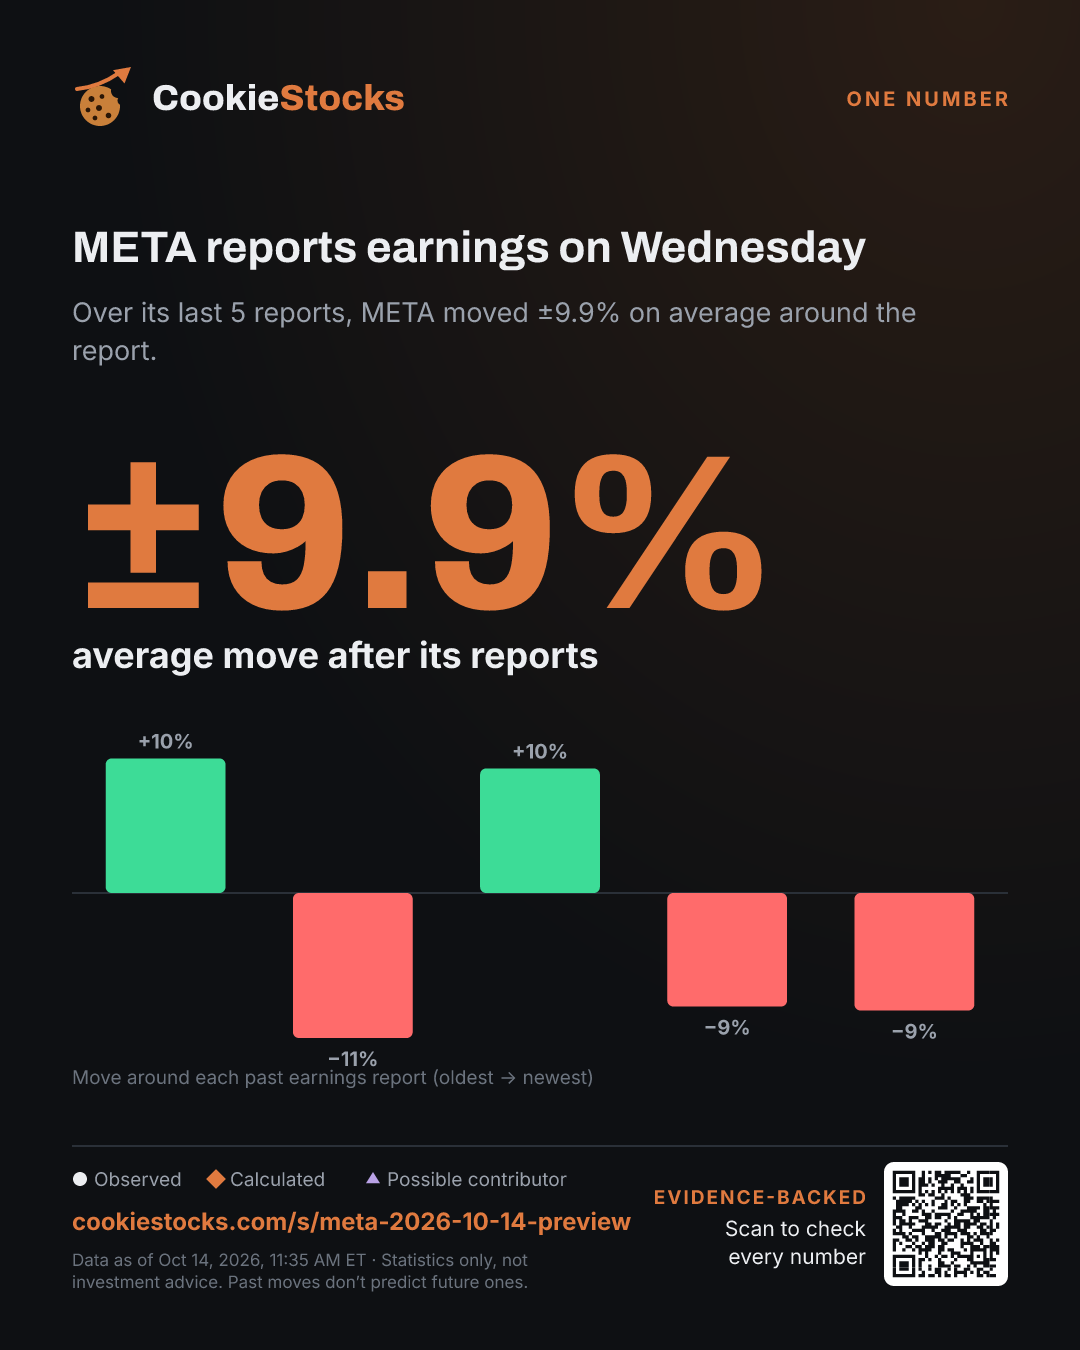 META reports earnings on Wednesday2026-10-14
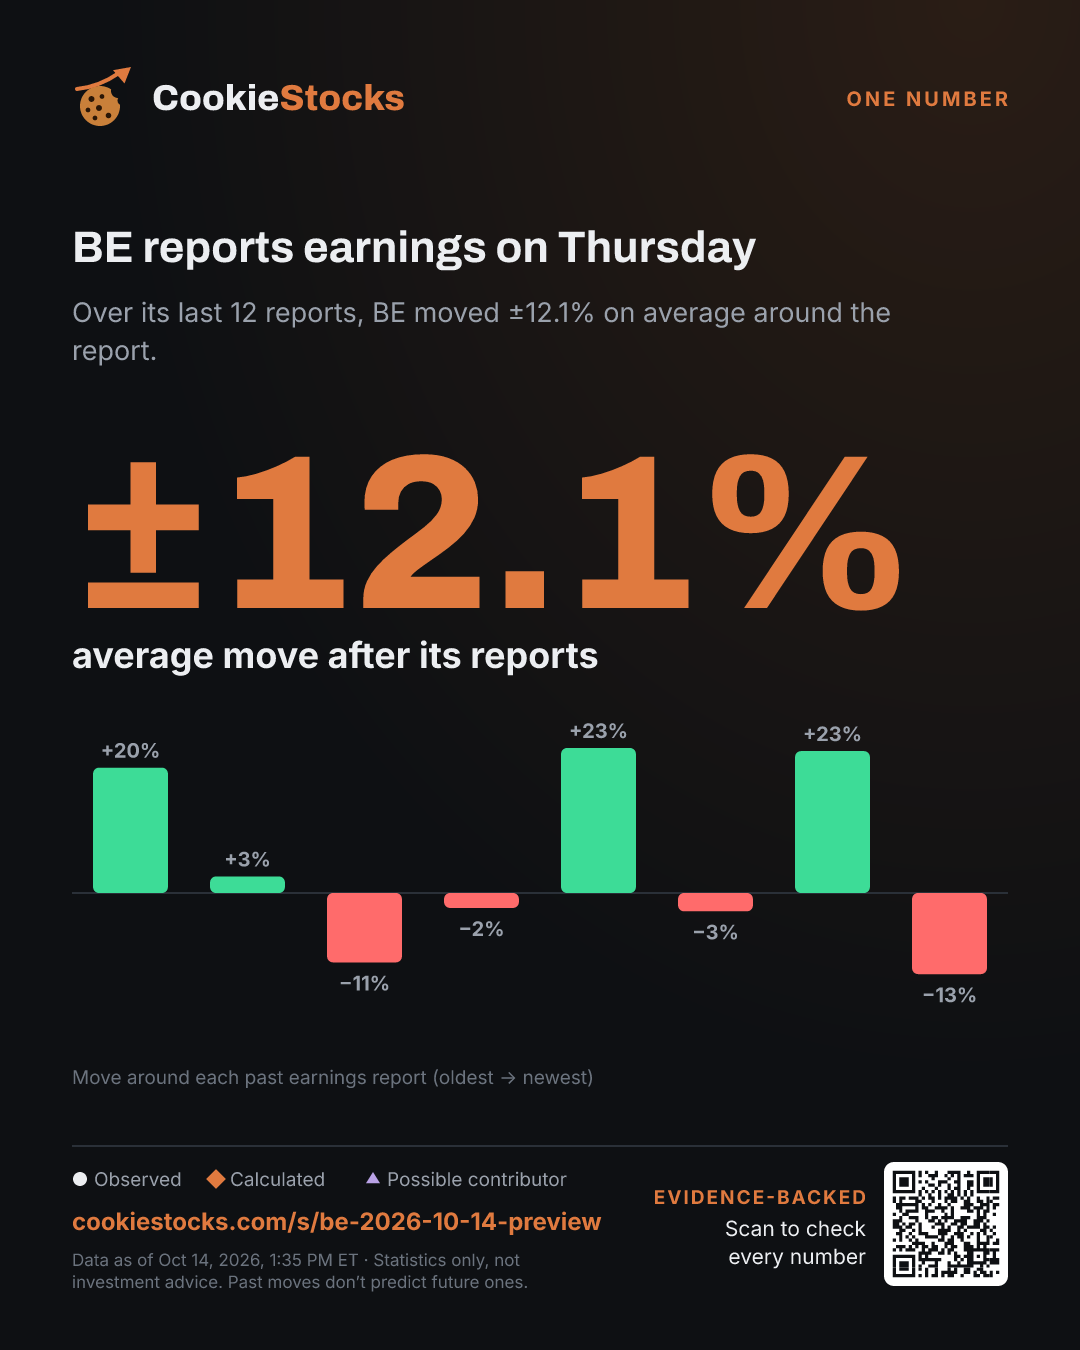 BE reports earnings on Thursday2026-10-14
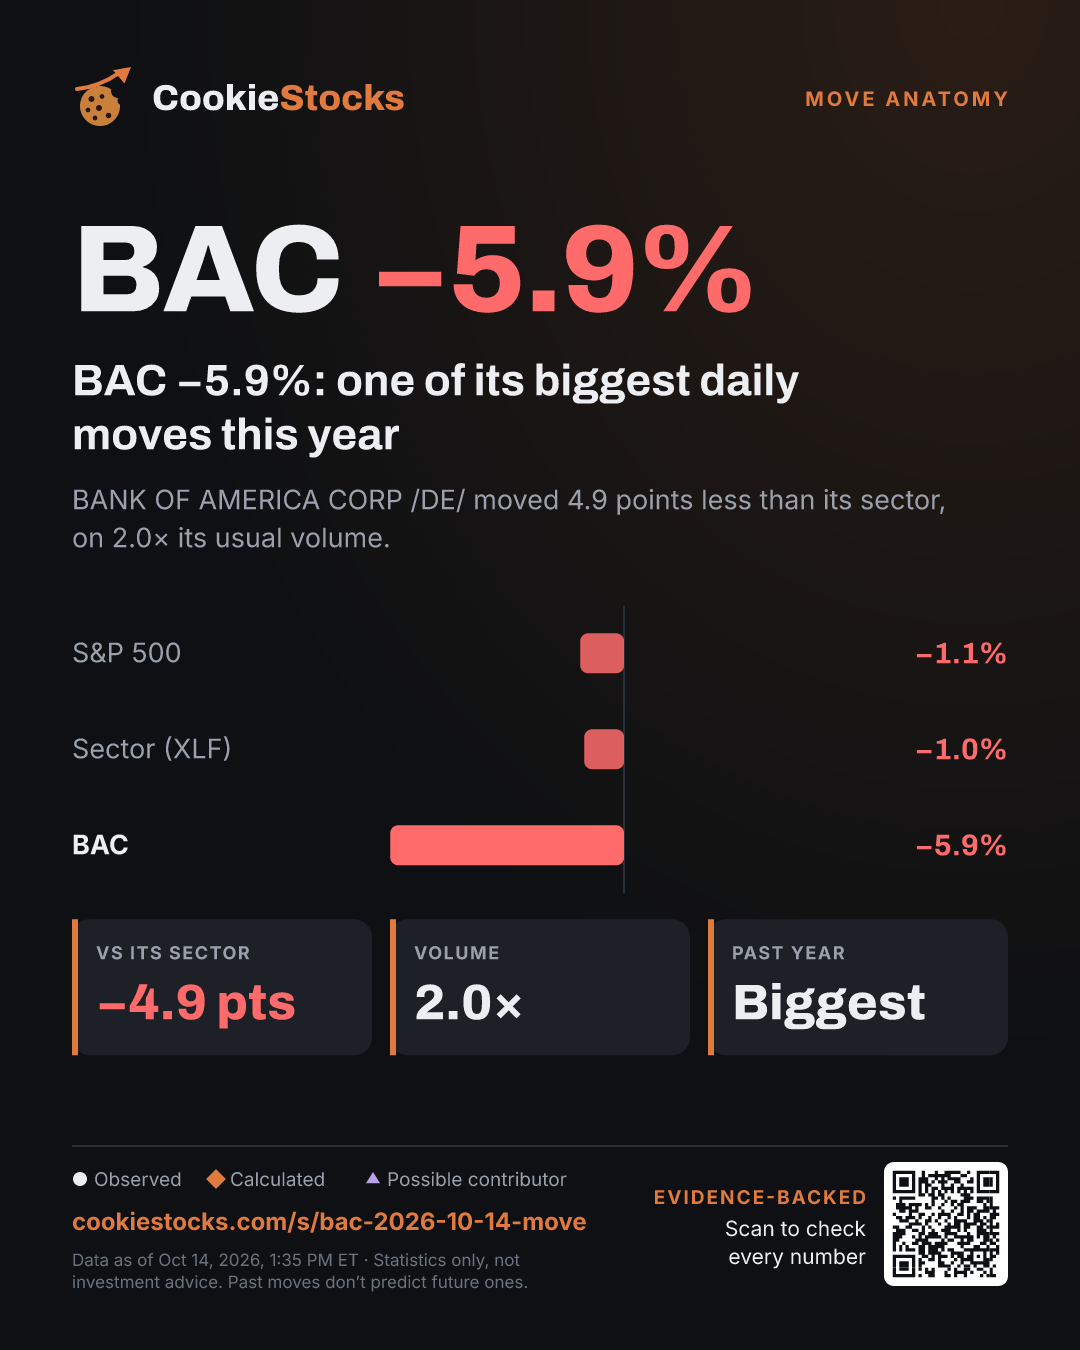 BAC −5.4%: one of its biggest daily moves this year2026-10-14
Statistics only, not investment advice. Past moves don’t predict future ones. Data as of Oct 14, 2026, 11:35 AM ET.