2026-09-30 · GIS
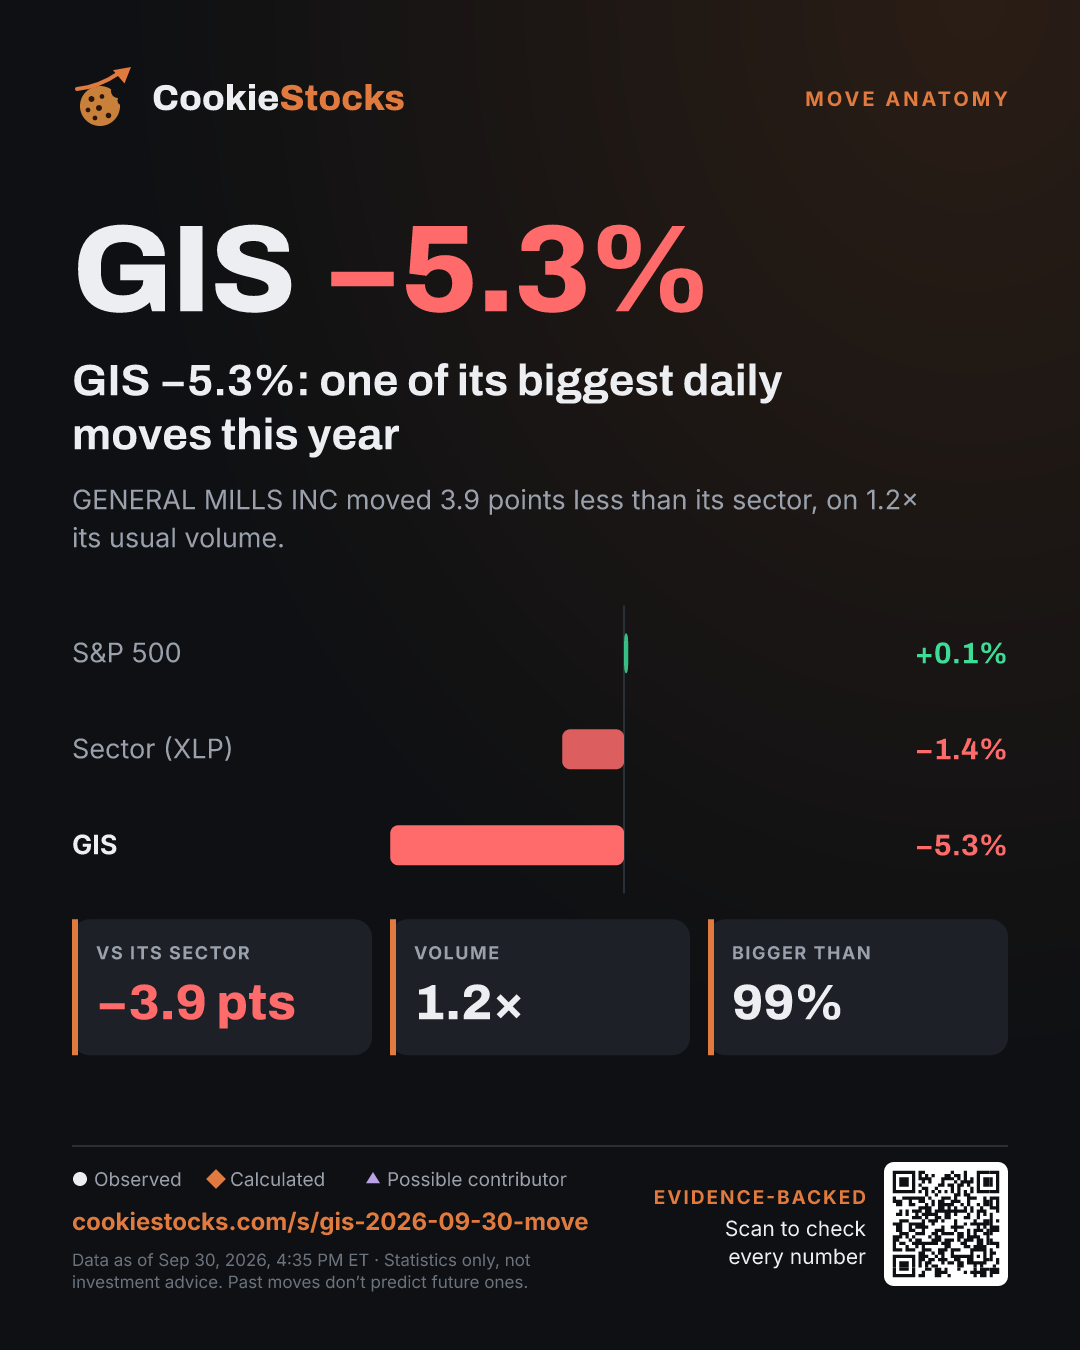
GIS −5.3%: one of its biggest daily moves this year
GENERAL MILLS INC moved 3.9 points less than its sector, on 1.2× its usual volume.
Prove it
Every claim on the graphic, labelled: observed (straight from the data), calculated (worked out from it), or possible contributor (lines up in time, not a confirmed cause).
- OBSERVEDGIS −5.3% todaySep 30, 2026, 4:35 PM ET
- OBSERVEDIts sector fund (XLP) −1.4% todaySep 30, 2026, 4:35 PM ET
- CALCULATED3.9 points less than its sectorHow: stock return − sector fund return · Sep 30, 2026, 4:35 PM ET
- OBSERVEDS&P 500 (SPY) +0.1% todaySep 30, 2026, 4:35 PM ET
- CALCULATEDVolume 1.2× its 20-day averageHow: today’s volume ÷ average of the last 20 days · Sep 30, 2026, 4:35 PM ET
- CALCULATEDBigger than 99% of its daily moves over the past 250 trading daysHow: share of past daily moves smaller in size · Sep 30, 2026, 4:35 PM ET
- POSSIBLE CONTRIBUTORNews: “Top S&P500 movers in Wednesday's session”Published around the move. Timing only, not a confirmed cause. · Sep 30, 2026, 3:05 PM ET
- POSSIBLE CONTRIBUTORNews: “Here's Why Investors Should Hold OMC Stock in Their Portfolios for Now”Published around the move. Timing only, not a confirmed cause. · Sep 30, 2026, 12:52 PM ET
- POSSIBLE CONTRIBUTOR8-K filed: Executive or director changeFiled around the move. Timing only. · Source: SEC EDGAR · Sep 30, 2026, 4:00 PM ET
- CALCULATEDAfter the 12 most similar GIS days since Oct 13, 2021, the stock was higher 5 days later 5 of 12 timesHistory, not a forecast. · How: same-company days with a move of similar size and direction
More stories
Statistics only, not investment advice. Past moves don’t predict future ones. Data as of Sep 30, 2026, 4:35 PM ET.